
Release 3 – better spreadsheet uploads for service designers

We’re excited to announce Release 3 of the Data Upload Design Kit – a set of user-centred patterns and components that make spreadsheet import journeys far more forgiving, faster and easier for real users.
This release adds robust date-format support (so users no longer wrestle with manual transformations), a visual validation experience that surfaces and groups spreadsheet errors in-context, and automatic handling of user-defined tables so users can skip repetitive setup steps.
Together these updates reduce common pain points in bulk data upload and give designers ready-made, testable patterns to improve accuracy and reduce frustration.
Date format support: no more manual messing with dates!
When services offer spreadsheet upload, they normally require a strict date format to be used throughout the sheet. The date format is picked by the designers or developers of the service and often isn't customisable. Users must change the dates used in their spreadsheet to work for the service.
But struggles with date formats are cited as one of the most common issues with Excel. Users find it challenging to transform dates in bulk, and often have to refer to expert advice or search engines to help. Making users transform dates is not good user-centred design.
We know that designing journeys to handle flexible date formats is a tedious challenge which designers often don’t have time for. So we've brought design patterns from user-friendly services that do this well into the Data Upload Design Kit to try and make them easy to apply for service designers.
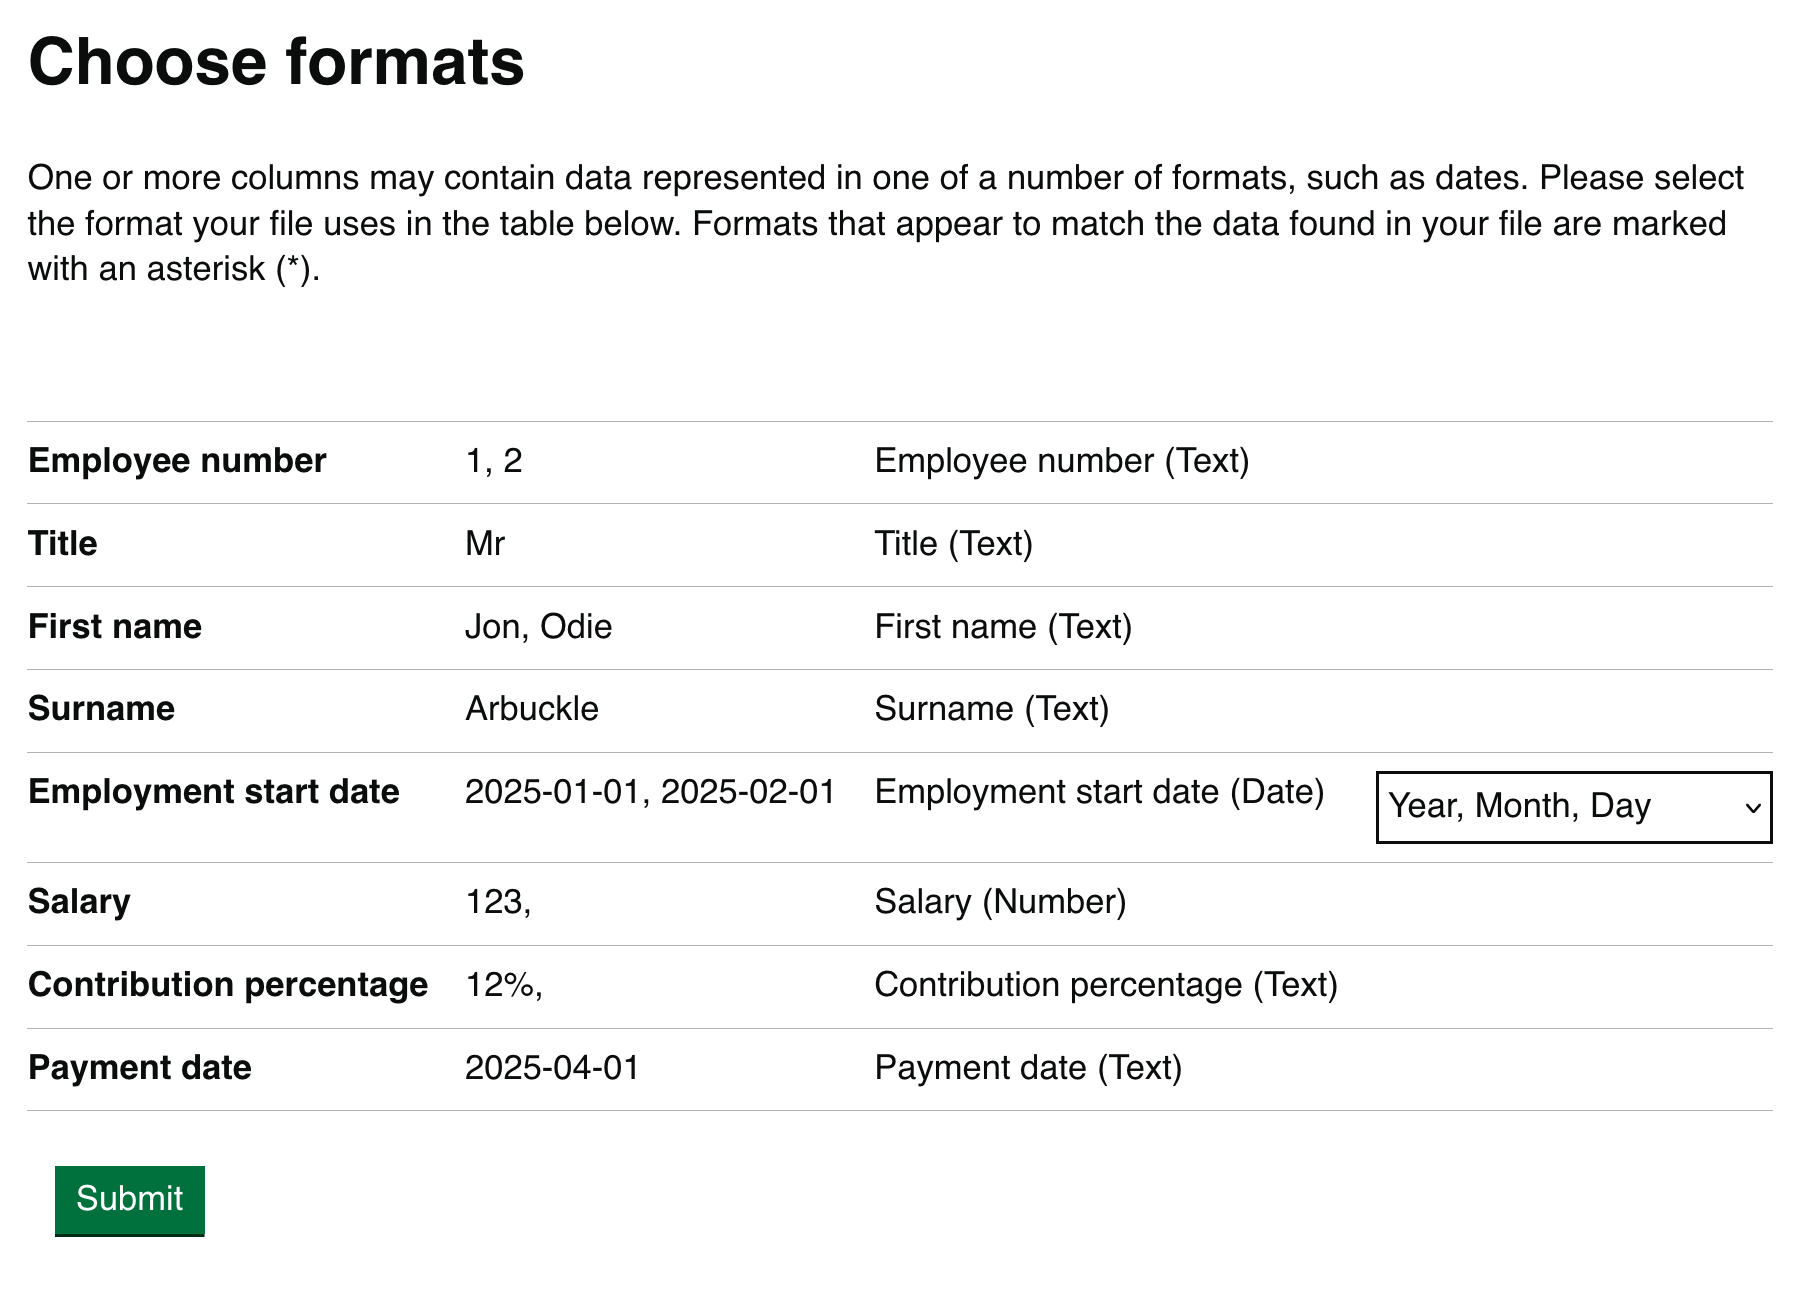
Our recommended spreadsheet upload journey now includes a format selection step if your service uses dates. Users can select from possible date formats to choose the one present in their data. Just like the column selection step, our design pattern includes showing users example values from each column to help them make the correct choice.
We've put a lot of work into making this design pattern as simple as possible for users. We've avoided the need for users to select whether their dates contain dashes, slashes, dots or some other delimiter, as these can be worked out by the computer. Users only need to select the ordering of their dates (e.g. Day, Month, Year or Month, Day, Year).
We can also auto-detect which date format is in the data. If a column contains dates that can only be one format, we'll show the user the format that is probably correct. If it's ambiguous, we'll show the formats that they possibly used. They can always select whichever format is right, and deal with any validation errors later.
Designers can now access a proper user-centred way of handling dates in spreadsheets uploads by using our Choose Formats design pattern, and without having to do any complex work themselves!
Visual validation: user-centred design experience around errors
A major issue with simple spreadsheet upload journeys is that they skimp on the unhappy path. But users approaching such a service for the first time almost never hit the happy path on the first try because of the many pain points around communicating what the service requires. So nearly every user will have to deal with a poorly designed unhappy path.
In Release 3, we're very proud to release a new user experience around errors that we call 'visual validation'. The design principle is to make errors visible to the user by showing them the data in their spreadsheet that failed validation, rather than trying to explain where the issue exists using text. That approach brings errors in spreadsheets up to scratch with the GOV.UK Design System guidance on validation.
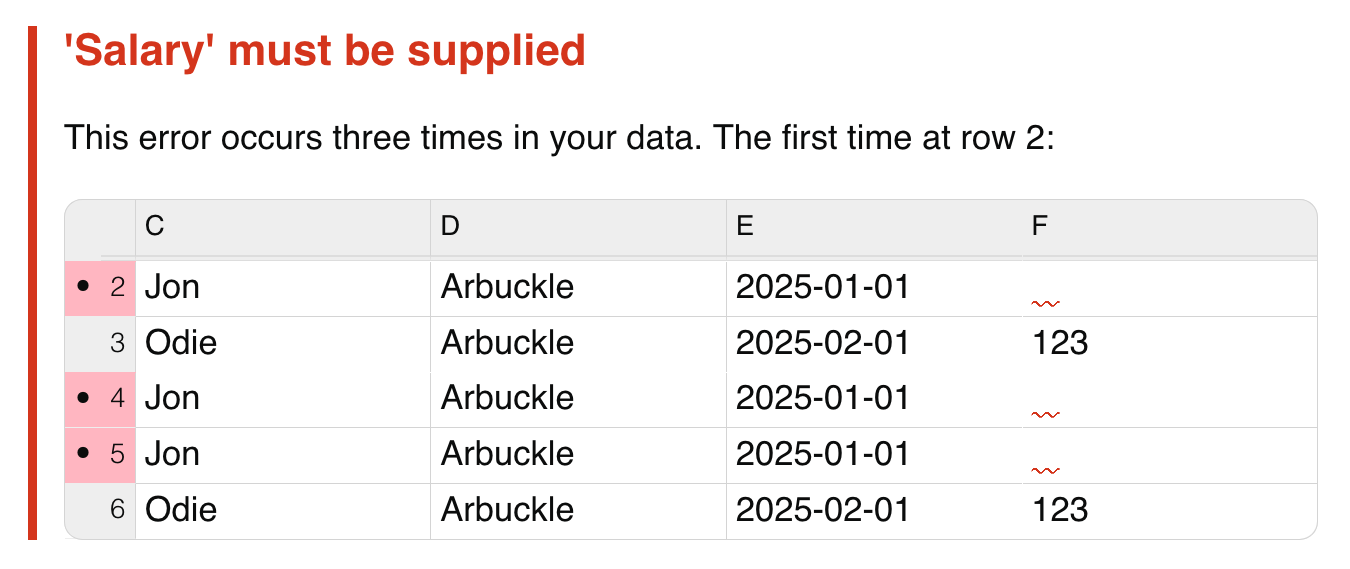
We show the user their erroneous data in context, as part of a familiar table interface, alongside other columns in the same row. This helps them understand why the error might have occurred. We also show valid rows from their data around the invalid row, to help show what good data might look like.
If one cell contains a problem, it often means other cells do too. So to avoid overwhelming the user with an enormous number of identical errors, we group errors about the same issue into one visual block, and communicate how many of them occurred. This allows users to solve a whole problem at once, rather than fixing one occurrence of an error and resubmitting to find the next.
Our design pattern is new, and we'd appreciate feedback from designers putting it into practice. We've made it easy for designers to customise all of the behaviour of our pattern, including the guidance that gets printed and how much context gets shown, and we'd like to see what you achieve. Please give it a try and get in touch with us to tell us about testing you've undertaken with it!
User defined tables: automatic import where these exist in spreadsheets
As part of our work to analyse over 27,000 spreadsheets from GOV.UK, we discovered that a significant 40% of Excel-based spreadsheets already contain structure that separates data from surrounding headings and titles. Users can declare a range of cells to be a named "user defined table" that contains a known number of rows and has column headings. With Google Sheets also increasingly pushing users to convert data into a table, it's likely that this percentage will tick up over time.
In Release 3, we've started to experiment with design patterns that allow users to save time by using a table already in their spreadsheet. A table selection step will automatically appear if users upload a spreadsheet containing tables, from which they can now pick a table and skip the data selection step. If they do this, table headers are used in the Choose Columns step.
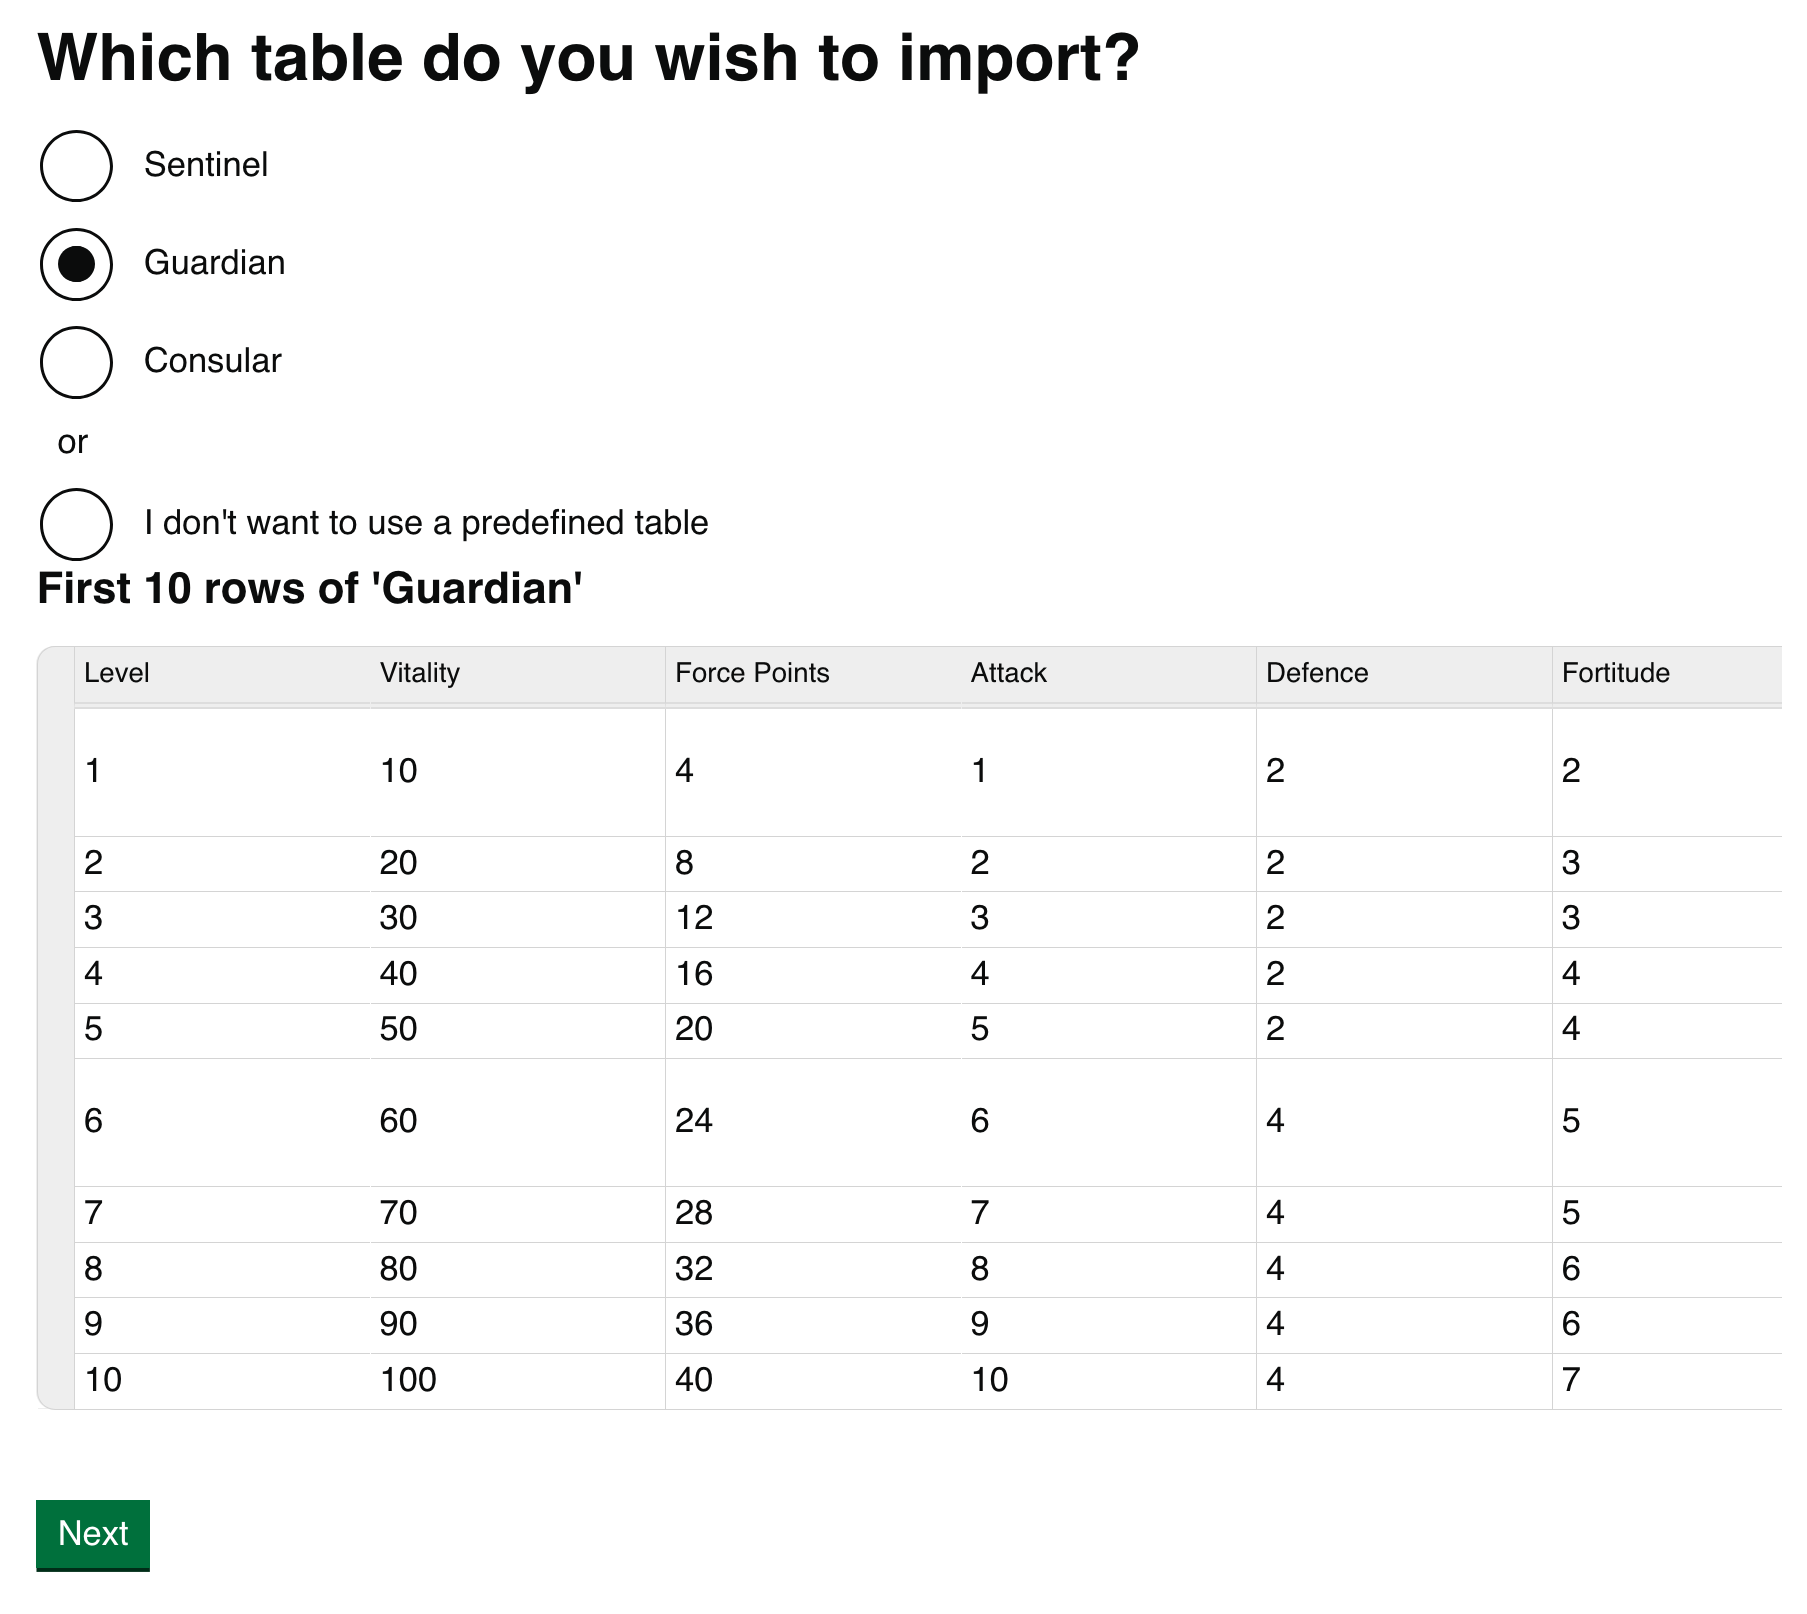
We've reused the design language from the Sheet Selector component in helping users pick tables, as the job to be done is largely the same: pick a table from options with potentially unfamiliar names. As per the Sheet Selector, we help users do this by showing previews of the data each choice contains, which will match the visual view they have in their spreadsheet program.
At the moment, the table selection step appears after the sheet selection step. We also considered reversing these steps, so that tables could be selected first and sheet selection ignored. So, we're interested in design feedback on this approach. If you have comments on how this might work in your service, please get in touch with us.
We're excited by the potential of this feature to save user time. It's also the MVP for future work around automatically detecting tables – now that we have a user journey that can appear when tables are found, we can work on algorithms to pick up tables automatically, and start to show these during a table selection step depending on confidence. Ideally, we'd like to help as many users as possible by correctly identifying their data tables without manual intervention.
Release 3 is available now
You can see all of these features (and everything from Release 2) in our demo service. The demo contains example spreadsheets that you can import to try out the features of the Data Upload Design Kit.
If you have comments or suggestions, or need help using the Kit, please get in touch with us! We're doing this work to improve the quality of spreadsheet services in Government, and your help by telling us what works makes that possible. Once again, thank you to all of the feedback we received on the Kit that went into Release 3!
If you want to try out the patterns and components in your own service, you can easily install the Data Upload Design Kit as a plugin for the GOV.UK Prototype Kit. Simply follow the instructions in our documentation to get started.
Author
